Sentry vs Datadog: different questions, different tools
Here's the thing. Sentry and Datadog show up in the same search because they share a few words: errors, tracing, alerts. But they start from different questions. Sentry starts from "what broke in my code, on which line, after which deploy?" Datadog starts from "what is my whole system doing right now, and why is that graph going the wrong way?"
If you're a small team choosing your first tool, my opinion is that most of you should start with Sentry, and the rest of this piece explains when that is wrong. Pricing below comes from each vendor's public pricing page, checked on 14 November 2026. I didn't install or run either product for this piece; everything here is from their docs and pricing pages, linked as I go.
What each one actually instruments
A quick vocabulary note, because both tools lean on it. A span is one timed unit of work: a database query, an HTTP call, a function. A trace is the tree of spans that make up a single request as it moves through your services. Tracing is how you find out that a slow checkout page was actually a slow call three services away.
Sentry instruments your application code. You add an SDK to your app, and it captures exceptions with stack traces, the breadcrumbs that led up to them, the release they happened in, and the commit that probably caused them. On top of errors it adds tracing, session replay, profiling, cron monitoring and uptime checks (Sentry docs). The unit of attention is the issue: a group of identical errors with a count, a first-seen time and an owner.
Datadog instruments your infrastructure, then everything on top of it. You install the Datadog Agent on hosts or as a container sidecar, and it collects host metrics, container metrics and integration data from databases, queues and cloud services (Datadog docs). APM (application performance monitoring, meaning traces from your code), logs, real user monitoring, synthetics and security products are separate SKUs on the same platform. The unit of attention is the graph and the monitor watching it.
Ask yourself: when something goes wrong at 3am, is the first question "which exception?" or "which host?" If your app runs on a managed platform where the hosts are somebody else's problem, it's almost always the first one.
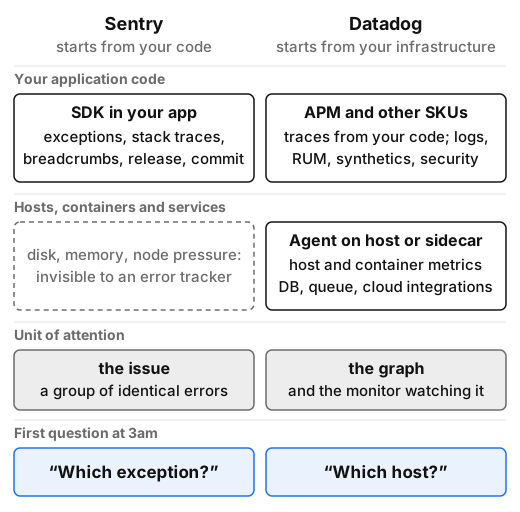 Sentry starts in your code; Datadog starts at the host and reaches up into your code with APM. Read down each column to the question it answers first.
How the bills grow
You are going to hate this answer: both bills grow with success. They just grow along different axes, and that changes what you have to watch.
Sentry bills by event volume. From the pricing page:
- Developer: free, one user, 5,000 errors, 5M spans, 50 replays a month, 30-day lookback.
- Team: $26/month billed annually ($29 monthly), unlimited users, 50,000 errors, 5M spans, 50 replays, up to 90-day lookback.
- Business: $80/month billed annually ($89 monthly), the same base quotas, plus extra features and sampled retention.
Above those quotas you either reserve more volume up front at a discount or set a pay-as-you-go budget. On Team, errors between 50k and 100k cost $0.0003625 each, falling to $0.0002188 between 100k and 500k; spans above 5M cost $0.000002 each (Sentry pricing docs). Rough maths, assuming each tier applies to the events within it: a Team plan seeing 200,000 errors a month lands somewhere around $66. The catch is the documented behaviour when you run out: "Any data sent after you've run through your reserved volume and PAYG budget will be dropped." You won't get a surprise bill. You will get a blind spot for the rest of the month, which is a different kind of surprise. Set the budget to match reality, and sample your noisiest errors and your traces.
Datadog bills by host, then by volume per product. From the pricing page:
- Infrastructure: free for up to five hosts with one-day metric retention; Pro is $15 per host per month annually ($18 on demand); Enterprise is $23 ($27).
- APM: from $31 per host per month annually when attached to infrastructure ($36 on demand), including 150 GB of span ingestion and 1 million indexed spans per host.
- Logs: from $0.10 per ingested GB, plus $1.70 per million log events indexed with 15-day retention ($2.55 on demand).
- Error Tracking: a flat $25 a month up to 50,000 errors, then tiered per thousand; included at no extra cost for errors from APM traces and RUM events.
Hosts are counted hourly, and you're billed on "the maximum count (high-water mark) of the lower 99 percent of usage for those hours" (Datadog billing docs). That's fairer than a raw peak, but an autoscaling group that sits high for more than about seven hours a month still sets the number. Custom metrics are billed separately, on the monthly average.
So a five-host setup with Pro infrastructure and APM starts at roughly $230 a month before a single log line. Add 50 GB of logs and 10 million indexed events and you're near $250. That's the floor for this setup; it moves with host count, log volume and how many custom metrics your team invents. Price your attention too: every dashboard someone builds is a dashboard someone has to keep true.
Self-hosting, alerting and the bits people forget
Self-hosting. Sentry can be self-hosted. Its code is under the Functional Source License, which lets you run it anywhere but not sell it as a competing service, and converts to Apache 2.0 after two years (self-hosted docs). The documented minimum is 4 CPU cores, 16 GB RAM plus 16 GB swap (32 GB recommended) and 20 GB of disk. It comes with "no guarantees or dedicated support", and some features, including spike protection and the AI features, aren't available. That's a real server to patch and back up. For a small team I'd only take that on if data residency forces it.
Datadog is SaaS only. The Agent itself is open source, but the backend isn't something you can run. If you need self-hosted metrics and dashboards, that's the Grafana and Prometheus world, which is a different piece.
Alerting. Sentry's alerts are built around issues: a new issue appears, an old one regresses, an issue crosses a frequency threshold, or a performance metric degrades. That maps cleanly onto "someone should look at this code." Datadog's monitors can watch nearly any metric, log query, trace or synthetic check, with anomaly and forecast options. That's far more flexible, and that flexibility is how teams end up with two hundred monitors and no idea which ones matter. If an alert fires and the right response is to ignore it, you don't have an alert. You have a very expensive notification sound.
Where Datadog is genuinely the better tool
Fair's fair. Datadog earns its reputation in a few places, and if these describe you, start there:
- You run your own hosts or Kubernetes. Disk, memory, node pressure and noisy neighbours are invisible to an error tracker. Datadog's infrastructure views and integrations cover this out of the box.
- Your incidents cross services. When the root cause is a saturated queue or a slow managed database, correlating traces, logs and host metrics on one timeline saves real time. That correlation is the product.
- You need one platform for several teams. Ops, security and product engineering looking at the same data, with one bill and one access model, has organisational value that a cheaper stack of tools doesn't.
Sentry, by contrast, is weaker at infrastructure and log analysis. It has added logs and metrics recently, but nobody should mistake it for a host monitoring tool.
When you need both, and your first step this week
Plenty of teams run both, and that's not a failure of discipline. They answer different questions. A common split: Sentry owns the "new exception after deploy" loop and routes issues to the team that owns the code; Datadog owns infrastructure, SLO dashboards and the pager for system-level symptoms. The cost is overlap: both will happily take your traces, so pick one home for tracing and sample in the other.
If you're starting with Sentry this week: sign up on the free Developer plan, add the SDK to your main service, and wire up release tracking so each error links to a deploy. Then set one alert: new issues in production, routed to a channel a human actually reads. Leave tracing at a low sample rate until you've seen a month of volume.
If you're starting with Datadog this week: install the Agent on up to five hosts on the free tier and look at what you get before you buy APM. Then write one monitor on a user-facing symptom, such as error rate or latency at the load balancer, not on CPU. Turn on the usage page before you turn on logs.
How to decide. If your app runs on a managed platform and your incidents are mostly "the code did something wrong", start with Sentry: it's cheaper, faster to set up, and it points straight at a line of code. If you run your own infrastructure and your incidents are mostly "the system is slow and we don't know where", start with Datadog and budget for it honestly. I'd change my mind on the default the day a small team's typical outage stops being a bad deploy. Until then, find out what broke first, and worry about what everything else is doing second. The rest of the field is in our monitoring and observability category.
About Nadia Farouk
Nadia writes from an on-call veteran's point of view: a conservatory dropout who took night shifts watching dashboards, carried a pager for years, then managed the people carrying them. Her pieces start from the question you have at 3am, put a price on everything, and borrow lessons from aviation accident reports. Away from dashboards, she referees roller derby, plays Satie late at night and grows tomatoes competitively.